 The Consumer Price Index (CPI) shows us inflationary pressures in the economy. The CPI measures the average price levels of a basket of goods and services purchased by consumers. The index starts with a base time period (1982-1984, currently) and shows the overall increase since that time. As with many economic indicators, it can be volatile from month to month, with food and energy prices often leading the volatility.
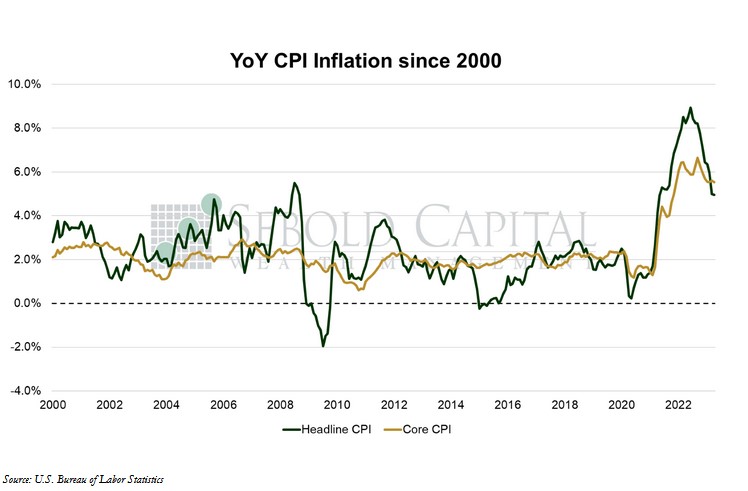
In April, the CPI increased to 302.9, coming in slightly below the consensus for the third consecutive month. On a monthly basis, consumer prices increased by 0.4%, right in line with expectations. The annual inflation rate declined from 5.0% to 4.9%, also in line with expectations, reaching its lowest value since May 2021. Core inflation, which excludes food and energy and is therefore considered to be less volatile, declined from 5.6% to 5.5%, with prices increasing 0.4% from the previous month. The core inflation print was also in line with expectations.
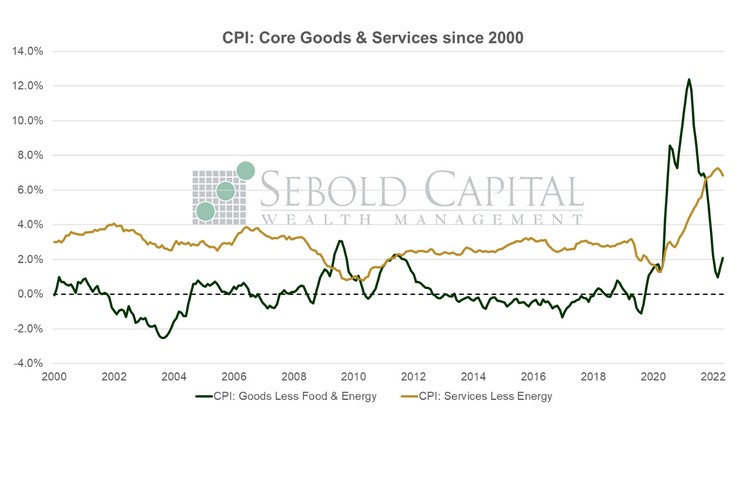
Inflation continued to decelerate last month, coming in with a four-handle for the first time in two years. The monthly data showed some volatility caused by higher energy and transportation prices. Energy prices overall increased by 0.6% from the previous month, while gasoline prices rose by 3.01%, the largest increase since October. However, both are still down considerably from the highs they reached last summer. Transportation costs rose 1.2% on a monthly basis, with used car prices increasing for the first time in nine months. Owners’ equivalent rent, which has been one of the primary reasons why core inflation has remained stubbornly high, increased by 8.1% on an annual basis, although it is now running at a relatively softer 0.5% monthly print (relative to 0.7% and 0.8% a few months ago). As we have noted before, there is a considerable lag between actual housing costs and the BLS estimate, so it will likely take a few more prints for this number to come down. Inflation for goods picked up slightly and is currently running at a 2.1% annual rate, while services inflation declined from 7.1% to 6.8%—its third month of a potentially downward trend.
Overall, this inflation report is unlikely to have a significant impact on the Fed’s plans for its next meeting in June. Naturally, there is no evidence to warrant another hike; the disinflation trend appears to be well established and it will likely continue for the remainder of the year. However, there is no evidence to warrant a rate cut either, meaning a pause is most likely. Shortly after the report’s release, the market is estimating the odds of no hike in June at 92.8%, a significant change from just the prior day when the estimated probability was 78.8%.
 May 10, 2023