 The Employment Situation is a report by the Bureau of Labor Statistics that gives us a look at the employment outlook of the US economy. The report does not include those employed in agriculture because of the seasonal nature of their work. This report obtains these numbers from 142,000 businesses and government agencies to track the new jobs added in non-farming sectors of the economy.
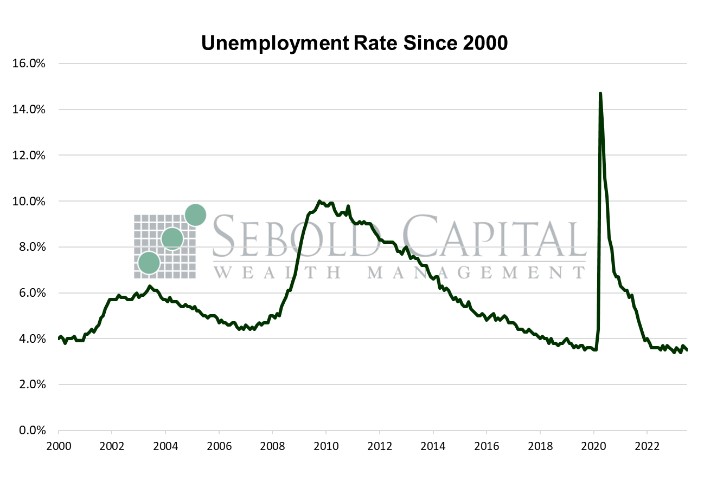
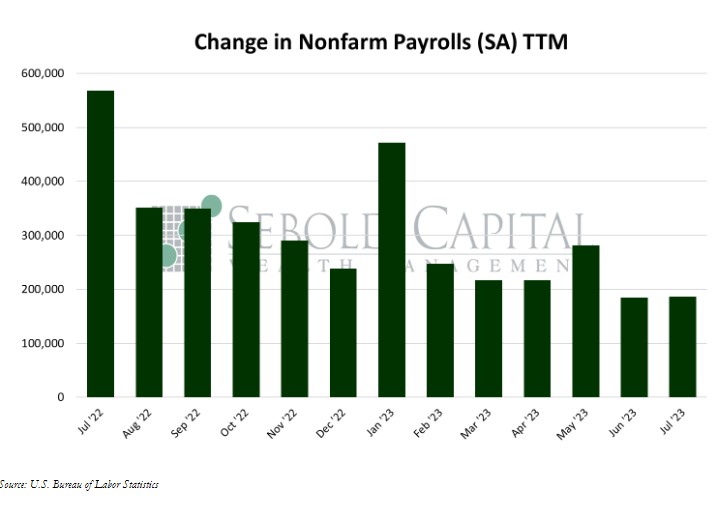
In July, U.S. employment rose by 187,000 on a seasonally adjusted basis, coming in below expectations for the second consecutive month. The consensus called for a gain of 200,000 jobs. The prints for May and June were also revised to the downside. May’s print saw its second downward revision (first from 339,000 to 306,000, then to 281,000), while June’s print was revised from 209,000 to 185,000, making it the first print below 200,000 since December 2020. Combined, the revisions effectively subtracted 82,000 jobs from July’s print. The headline unemployment rate fell from 3.6% to 3.5%; it was expected to remain at 3.6%. The average week decreased marginally from 34.4 hours to 34.3, while average hourly earnings rose by 0.42% to $33.74. The labor force participation rate remained unchanged at 62.6% for the fifth consecutive month. It remains below its pre-pandemic level of 63.4%
Hiring continued to moderate last month, with the employment report posting the second consecutive miss for a series that, until two months ago, had enjoyed fourteen consecutive beats. It also brought with it more downward revisions. Every single print in 2023 has been revised to the downside. The trend coincides with the JOLTs data that, although lagging by two months, shows labor demand softening. About a third of job gains in July came from the health care sector. Financial activities, social assistance, and wholesale trade made significant contributions to the headline as well. Employment in business services and manufacturing declined last month. The Household Survey-which is used to calculate the unemployment rate and came in stronger than the Establishment Survey last month-revealed that the number of people working full-time dropped, while part-time work increased. The number of people working more than one job also increased.
The jobs report is beginning to show signs of slowing growth, at least as you look in the rear-view mirror. All the revisions show this. This could be as a result of the lackluster response rate of the business surveys. What the headline data is not showing is that wages are still increasing, which will continue to put upward pressure on inflation and lower earnings expectations. It is hard to see another Fed hike in the upcoming meeting in September, but that is many economic data points from now. Earnings this quarter are going to come in very slow. This may put enough pressure on the Fed to do nothing at the upcoming meeting. That is our expectation.
August 4, 2023