 Consumer spending, measured by Personal Consumption Expenditures (PCE), makes up approximately two-thirds of the economy and is a direct measure of purchasing activity. PCE is a reliable indication of inflation because it is calculated from data acquired directly from the GDP report and businesses. It shows us where consumers are spending their dollars, whether it be durable and non-durable goods, or on services. Changes in the personal income level usually dictate consumer spending.
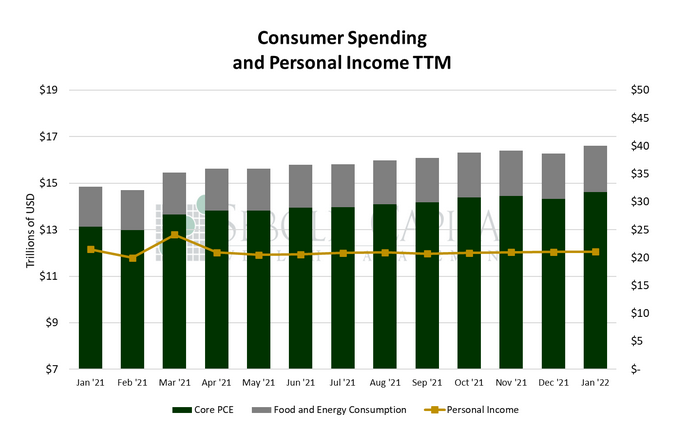
In January, personal consumption rose by 2.07% to $16.62 trillion, while personal income rose by 0.4% to $21.04 trillion. Excluding food and energy, consumption rose by 2.10% to $14.62 trillion. Spending on durable goods surged by 9.67% to $2.18 trillion after two consecutive months of decline, while spending on nondurable goods rose by $2.62% to $3.65 trillion. Spending on services rose by 0.48% to $10.79 trillion.
Consumer spending picked up in January after a brief slump in the previous month, even though personal income was relatively flat over that period. December’s decline was downwardly revised from -0.6% to -0.8%, but January’s print was more than enough to make up for that. However, the good news stops there; another key component of the report commanded all the attention, and with good reason. Inflation, as measured by the PCE price index, rose to 6.1% on an annual basis—yet another inflation indicator that hits a 40-year high. More importantly, core PCE inflation rose to 5.2%, its highest value in 38 years. Core PCE serves as the Federal Reserve’s preferred measure of inflation, so it will undoubtedly play an important role in shaping the Fed’s approach to raising interest rates. Both measures came in above market expectations, continuing the trend of forecasters underestimating the price pressures felt throughout the economy.
The PCE price index has a different methodology than other measures of inflation, such as the CPI. For instance, prices for cars and trucks are given a smaller weight on the PCE index compared to the CPI. Housing may be the main factor that differentiates the two; home prices make up about one fifth of the PCE index, while their weight on the CPI almost twice that amount. However, both indexes suffer from the same effects of using Owners’ Equivalent Rent instead of actual home prices and rents. OER, which is calculated from the results of a survey, fails to reflect true housing costs since homeowners are usually not up to date with the latest developments in the housing market. For instance, OER rose by 3.8% on an annual basis in 2021, while the S&P/Case Shiller US National Home Price Index surged by 18.6% over that same period. Since the PCE index assigns a lower weight to housing, it is not surprising that it lags behind the CPI, which rose by 7.5% on an annual basis in January.
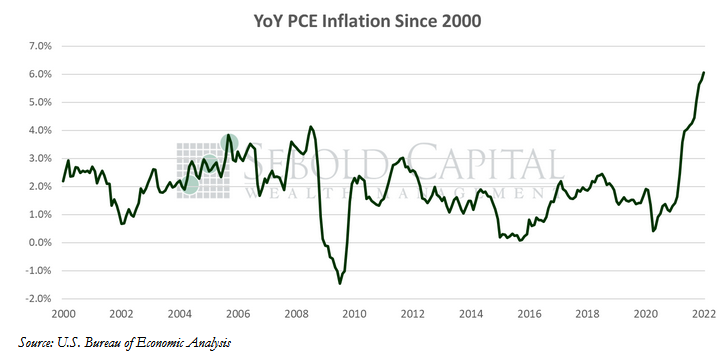
The fact that nearly all inflation measures are hitting their highest level since the early 1980’s is a clear indicator of historically high pressure on prices. While there are higher interest rates on the horizon, it is unclear if a few quarter-point hikes will be enough to make a considerable dent on the hottest inflation in four decades. While many of the indicators used by the Fed to gauge economic conditions seem to indicate that the economy is in a position to withstand higher interest rates, the current uncertainty resulting from the situation in Ukraine may dissuade the Fed from pursing more aggressive hikes. In the meantime, price pressures keep building up and are unlikely to wind down on their own, meaning consumers should continue to brace themselves for higher prices—at least for the coming months. 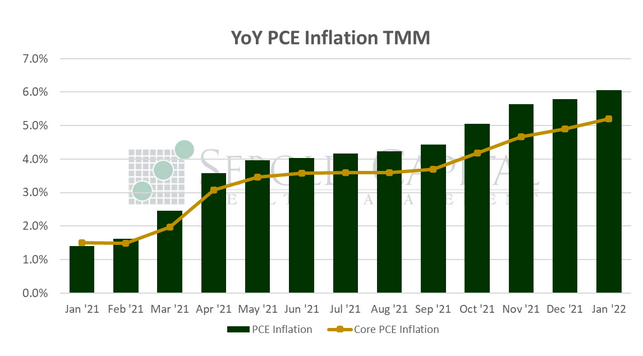
February 25, 2022