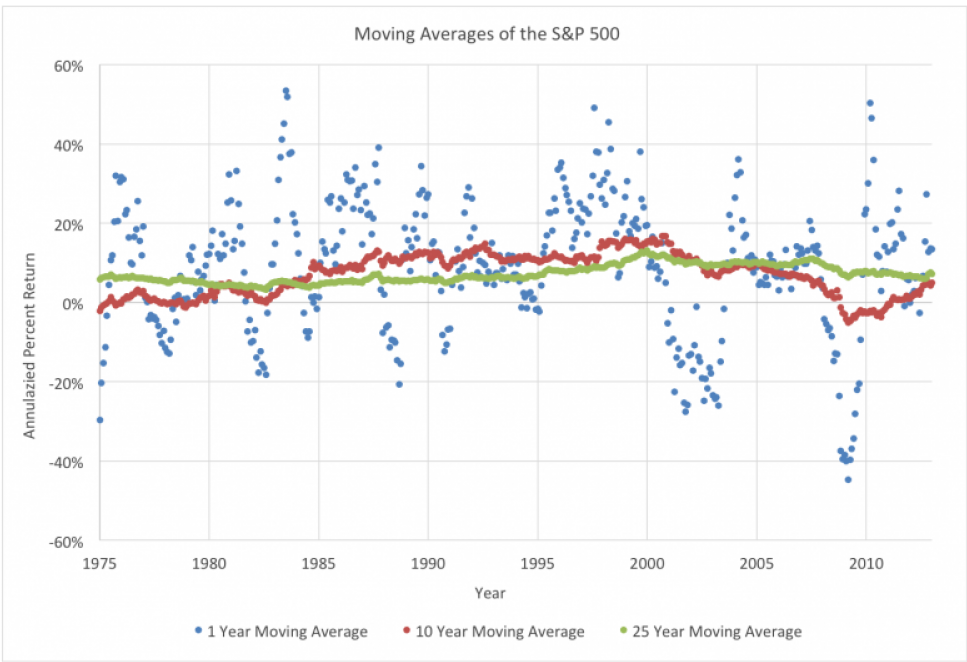
The historical annual return of the S&P 500 index back to 1957 is 9.62%. Interestingly, the market almost never returns the average. In 1958, the market returned 43%, while in 2008, it dropped 37%. To try to visualize how rarely the index returns just its average, this chart shows one year moving averages in blue. You can see drastic variance from month to month and year to year. There are not a lot of blue dots near the eight percent line. Now when we give the market more time to revert to the mean, shown in red- the ten year moving average, and in green- the 25 year moving average, we can see the average come to light. It is through volatility that we are able to find returns. Over long periods of time- ten to over twenty years, the market reverts to its average thanks to the often exaggerated and unpredictable short term returns.

April 6, 2015
