 The Consumer Price Index (CPI) shows us inflationary pressures in the economy. The CPI measures the average price levels of a basket of goods and services purchased by consumers. The index starts with a base time period (1982-1984, currently) and shows the overall increase since that time. As with many economic indicators, it can be volatile from month to month, with food and energy prices often leading the volatility.
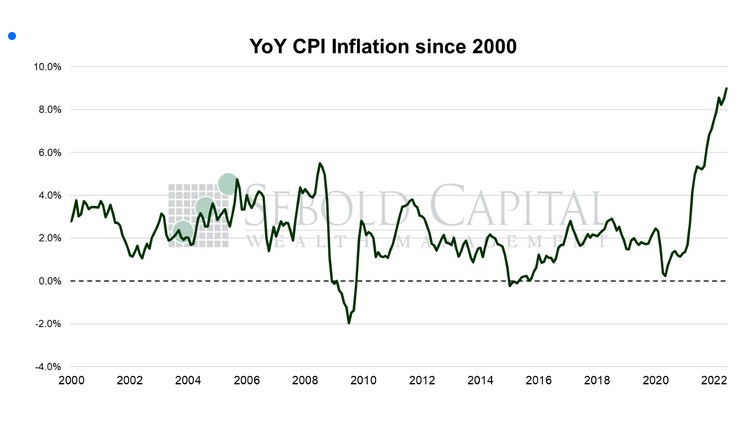
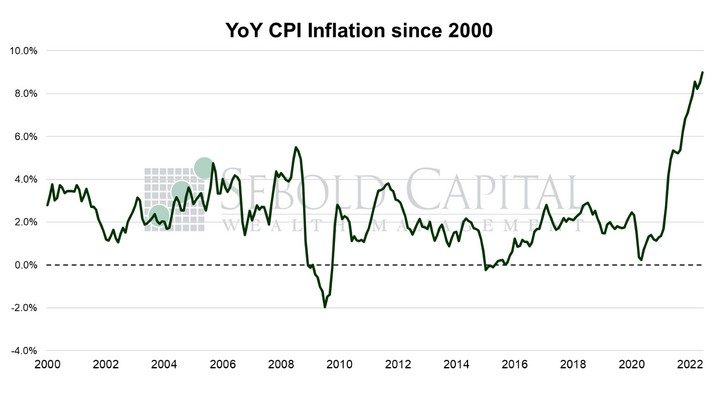
In June, the CPI surged by 1.3% to a level of 295.3, exceeding market expectations of a 1.1% advance. Year-over-year inflation rose to 9.1%, hitting its highest level since 1981. Core CPI—which excludes prices for food and energy and is therefore considered to be less volatile—rose by 0.7%, above market expectations of 0.5%, to a level of 294.3. Core inflation declined for the second consecutive month to 5.9%, although it still came in above the consensus of 5.7%.
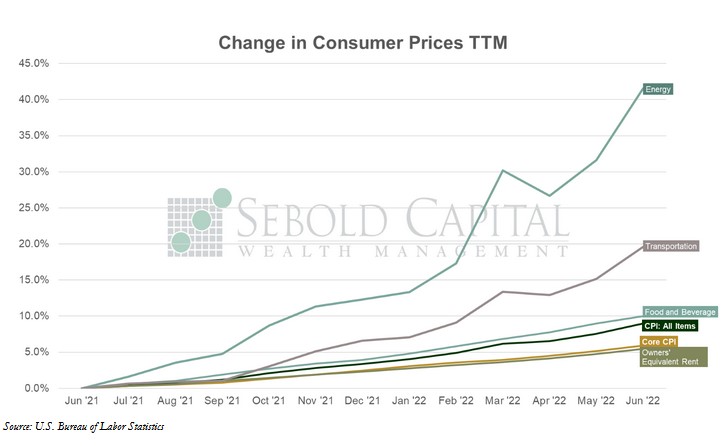
Consumer prices continued their relentless advance last month, eclipsing May’s 8.6% annual inflation rate. Gasoline prices were the primary contributor to June’s inflation print, soaring 11.2% on a month-over-month basis and 59.9% on the year. Energy prices in general accelerated last month, rising by 7.5%. The cost of food rose at an annual rate of 10.0%, also contributing to the outsized increase in prices. Those tasked with measuring inflation would hope that by excluding the former categories, the numbers may be easing to stomach. However, even when pretending that consumers can simply choose to ignore food and energy prices, the numbers still look rather abysmal. Sure, core inflation eased slightly on an annual basis, but it accelerated relative to May. The rate of change—a whole eight basis points—matters less in this case than the direction of said change. If even so-called core prices continue to increase at a faster rate, how can anyone expect inflation in general to ease?
Now, the good news is that this is last month’s data; this already happened. Certain prices, especially in the commodities space, have eased recently as concerns about a global slowdown in economic growth intensify. Gasoline prices, for instance, peaked in early June and have begun to come down since then. However, other factors are likely to keep the CPI elevated for the foreseeable future. Housing is the single largest component of the index, and due to the way in which the BLS measures this category, the actual extent to which housing costs have increased has yet to show up in the CPI. Owners’ equivalent rent, the CPI’s primary measure of housing costs, tends to lag behind actual costs. That means that OER, which rose at an annual rate 5.5% (up from 5.1% in May), likely continues to have plenty of room to the upside and will be a driving force behind upcoming CPI prints.
Yet another hotter-than-expected inflation puts even more pressure on the Federal Reserve to take what they consider to be decisive action. The FOMC surprised everyone last month and opted to raise interest rates by 0.75% instead of the 0.50% that had long been the expectation. That was precisely in response to May’s inflation print coming in above expectations, which calls into question what the Fed will do in its next meeting. Just yesterday, the market overwhelmingly expected another 75-basis-point hike. At the time of writing, expectations have overwhelmingly shifted towards a full-point hike. After last month’s meeting, it would be unwise to discount that possibility. A Fed Funds Rate between 2.5% and 2.75% would remain relatively low by historical standards, but it is certainly closer to what is needed to tame rapidly rising prices.
July 13, 2022