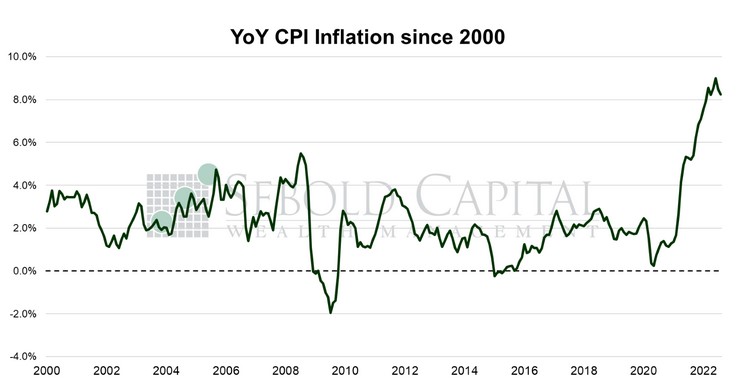
 The Consumer Price Index (CPI) shows us inflationary pressures in the economy. The CPI measures the average price levels of a basket of goods and services purchased by consumers. The index starts with a base time period (1982-1984, currently) and shows the overall increase since that time. As with many economic indicators, it can be volatile from month to month, with food and energy prices often leading the volatility.
In August, the CPI remained nearly unchanged at 295.6, coming in just slightly above expectations. The month-over-month inflation rate was 0.1%, exceeding expectations of -0.2%. While the year-over-year print declined from 8.5% to 8.3%, it likewise came in above the 8.1% forecast and remained near a four-decade high. Core CPI—which excludes prices for food and energy and is therefore considered to be less volatile—rose by 0.6% for the month, also above its forecast. Year-over-year core inflation increased from 5.9% to 6.3%, its highest level since March.
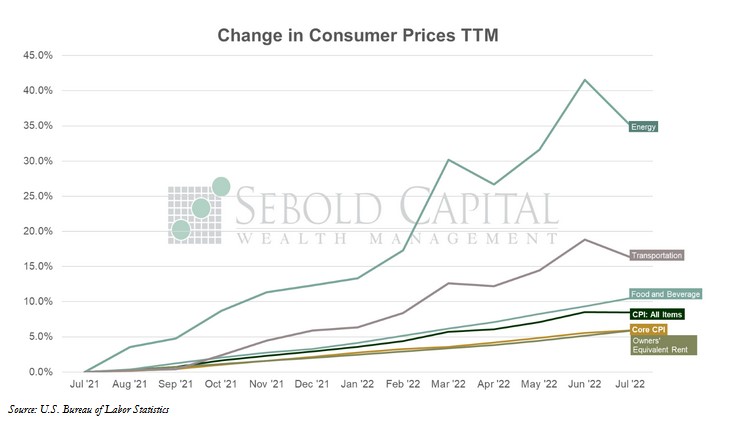
Despite easing energy prices, inflation remained high last month, showing that price pressures are still present at different levels of the economy. Energy prices fell 5.0% in aggregate, although they remain 23.9% higher relative to the previous year. Gasoline prices saw their largest decline since April 2020, when demand plummeted as the economy was largely shut down. However, food prices continued to climb, increasing 0.8% on the month and rising at an annual rate of 10.9%. One of the drivers of higher prices at the grocery store is transportation costs, which are themselves influenced by fuel prices. Even though fuel prices have come down, it will likely take a few months for those changes to be reflected, meaning that we will likely continue to see higher food prices over the near term.
Falling energy prices improve the outlook for inflation over the long term, but gains in other categories are offsetting this much awaited moderation. There were significant increases in the cost of shelter and medical services, which admittedly tend to lag behind more volatile indicators. For instance, owners’ equivalent rent—which attempts to measure housing costs—lags several quarters behind actual home prices, meaning it is only now reflecting the huge gains in real estate seen last year and will take just as long to reflect prices coming down as a result of higher mortgage rates. Housing costs account for around one third of the headline report (and an even higher share when food and energy are excluded), meaning they will continue to drive higher prints even as other prices continue to moderate. For now, this means that at least one more 0.75% hike is almost a certainty. The Fed tends to pay more attention to core prices, so they are unlikely to stop the hiking cycle until they see some significant improvements in those numbers.
September 13, 2022