 The Consumer Price Index (CPI) shows us inflationary pressures in the economy. The CPI measures the average price levels of a basket of goods and services purchased by consumers. The index starts with a base time period (1982-1984, currently) and shows the overall increase since that time. As with many economic indicators, it can be volatile from month to month, with food and energy prices often leading the volatility.
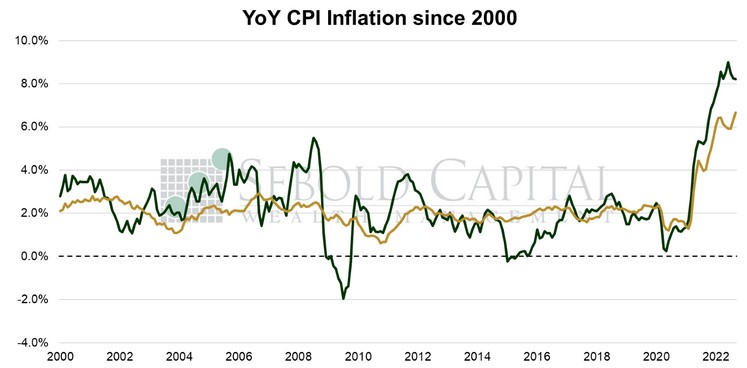
In September, the CPI rose to 296.8, coming in above expectations. The month-over-month inflation rate was 0.4%, about double the consensus. However, the year-over-year print saw a marginal decline from 8.3% to 8.2%, just above the consensus of 8.1%. Core CPI—which excludes prices for food and energy and is therefore considered to be less volatile—rose by 0.6% again, also exceeding market expectations by a small margin. Year-over-year core inflation increased from 6.3% to 6.7%—its highest level since 1982.
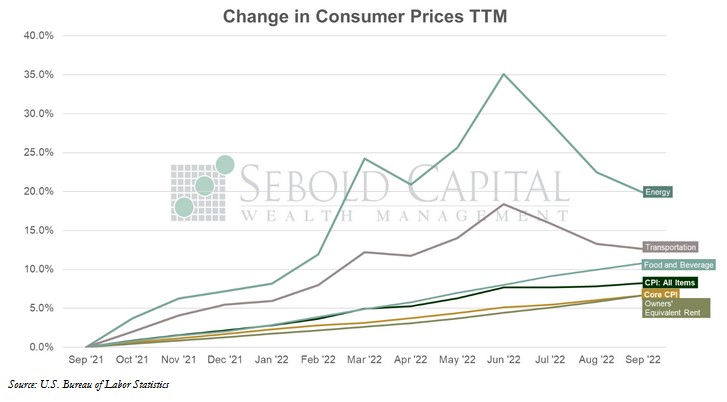
Just when everyone thought we were done hitting forty-year highs and inflation had finally peaked, consumer prices decided to tell a different story last month. At least core prices did; ironically, the usually volatile headline had somewhat of a moderating effect relative to core. Energy prices eased for the third consecutive month, posting a 2.1% decline in September. Gasoline prices saw a 4.9% drop. However, food and beverage prices continued to increase at a particularly fast pace, rising by 0.7%. That offset some of the improvements coming from the energy sector. However, what is now truly driving the index (both the headline, but especially core) is Owners’ Equivalent Rent—the Bureau of Labor Statistics’ attempt at measuring increases in the cost of shelter. Housing costs saw their largest monthly increase since 1990 at 0.8%, and on an annual basis, the 6.7% print was the highest since the early 1980’s. The cost of medical care also rose by 0.8%, although it makes up a much smaller portion of the index. Other services became more expensive as well. Transportation and apparel costs declined, but clearly not by enough to offset housing costs in any meaningful way.
It is clear that shelter costs—or at least the BLS’ proxy for them—are going to be driving the inflation story from now on. We may see some pressure on energy prices again coming from the situation in Europe and production cuts by OPEC, but it is likely that shelter costs will dominate. What is particularly unfortunate is that the measurement used by the BLS hardly resembles any actual data, and it lags behind actual prices by several months. Even as housing prices continue falling rapidly due to skyrocketing mortgage rates, OER will continue to increase for the foreseeable future. That presents a problem when the Federal Reserve is looking at that data in order to make monetary policy decisions.
Price pressures remain broad, but likely not broad enough to justify continuing to raise interest rates quite so aggressively. Not only is there a significant lag between one third of the CPI and actual data, but there is also a lag with monetary policy; the effects of every interest rate increase are not fully felt until perhaps even quarters later. There are also signs that supply chain pressures may be subsiding; while those are technically not inflationary on their own, they certainly do not make at situation where there is too much money in the economy any better. We will not see the latest M2 print until later this month, but it has thankfully remained nearly flat since April. The Fed needs to keep that in mind before looking at an admittedly hot CPI print and suddenly deciding they need to embody Paul Volcker.
October 13, 2022