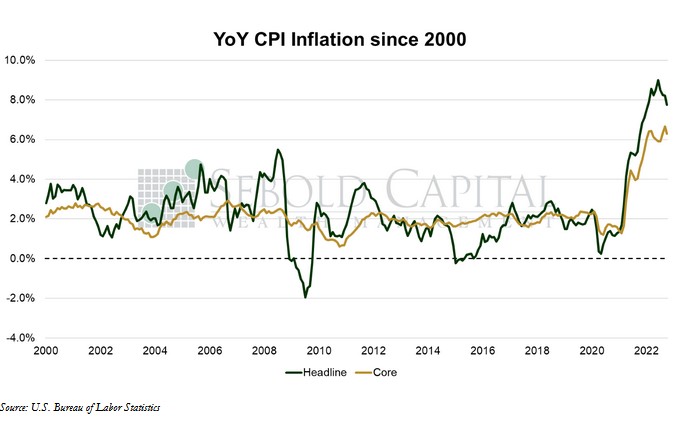
 The Consumer Price Index (CPI) shows us inflationary pressures in the economy. The CPI measures the average price levels of a basket of goods and services purchased by consumers. The index starts with a base time period (1982-1984, currently) and shows the overall increase since that time. As with many economic indicators, it can be volatile from month to month, with food and energy prices often leading the volatility.
In October, the CPI rose to 298.06, coming in below expectations. The month-over-month inflation rate was 0.4%, below the consensus of 0.6%. The year-over-year print fell from 8.2% to 7.8%, below the expected 8.0%. Core CPI—which excludes prices for food and energy and is therefore considered to be less volatile—rose by 0.3% on a monthly basis, also well below expectations. On an annual basis, core inflation declined by 6.7% to 6.3%, falling from a forty-year high.
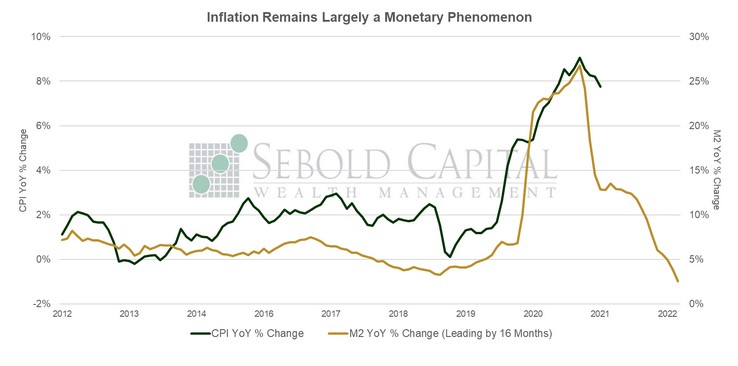
It appears that we cannot go a single month in 2022 without an inflation surprise. This surprise, however, was to the downside. Expectations were for inflation to decline moderately; instead, we got the second largest decline in the inflation rate of the year. However, inflation remains near historic highs, although perhaps not for long. It appears that inflation continues to be largely a monetary phenomenon. It soared after reckless monetary and fiscal policies increased the money supply by 40%, and now that monetary expansion has ceased, inflation can moderate. The latest M2 prints have been flat, pointing to an eventual decline in the inflation rate. Raising interest rates and quantitative tightening, which also impact the economy with a lag, are likely to accelerate the process. However, a decline in inflation does not mean a decline in prices; disinflation is not the same as deflation. All it means is that prices will stop increasing at the alarmingly fast rate seen over the past year or so.
The report shows that, although M2 has flattened out, other price pressures remain present throughout the economy. The cost of services continues to increase at a faster pace than the cost of goods. Energy prices rose again after declining for three consecutive months. Gasoline increased by 4.0% relative to the previous month, while fuel prices overall went up 10.5%. Food and beverage prices saw little moderation, with the monthly print falling from 0.7% to 0.6%. Housing costs—which as we have previously mentioned, have a significant impact on the CPI—increased at a slightly more moderate pace in October, but the annual print increased from 6.7% to 6.9%. There is a significant lag between the measure that the BLS uses—Owner’s Equivalent Rent—and actual housing costs. The OER print is set to fall dramatically in the coming months as it catches up to reality, but it will likely keep the CPI elevated in the meantime.
There have been improvements in some categories. Used cars and trucks, which used to be one of the main drivers of the CPI, posted their fourth consecutive monthly decline, falling by 2.4%. The cost of medical care fell by 0.5%, dragged down by a 4.0% decline in insurance premiums (although this was largely a statistical effect of the index’s methodology). Airline fares also declined, as did apparel costs, which fell by 0.7%. The CPI will likely continue to decelerate in the coming months. The implications for monetary policy are a bit less clear. Will the Fed be satisfied with seeing the data trend in the right direction, or will they continue to hike until their targets are reached. Our expectation is that they will begin to moderate the rhetoric, but the data will determine the rate.
November 10, 2022