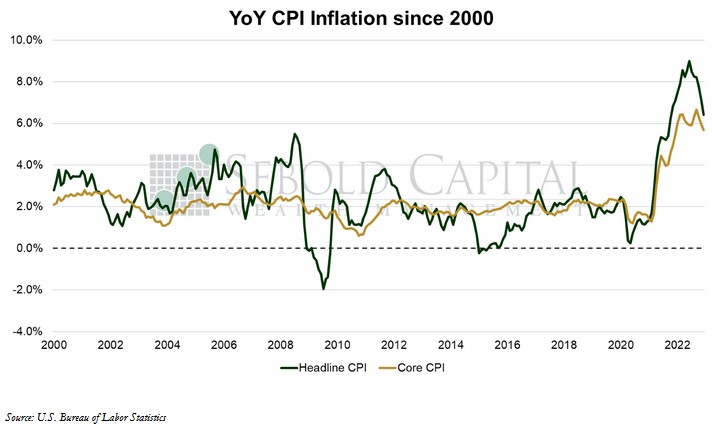
 The Consumer Price Index (CPI) shows us inflationary pressures in the economy. The CPI measures the average price levels of a basket of goods and services purchased by consumers. The index starts with a base time period (1982-1984, currently) and shows the overall increase since that time. As with many economic indicators, it can be volatile from month to month, with food and energy prices often leading the volatility.
In December, the CPI declined to 298.1, matching market expectations. The month-over-month inflation rate turned negative, coming in at -0.1%. The year-over-year inflation print fell from 7.1% to 6.5%, its lowest value since late 2021. Core CPI-which excludes prices for food and energy and is therefore considered to be less volatile-rose by 0.3% on a monthly basis. However, year-over-year core inflation declined from 6.0% to 5.7%, right in line with expectations.
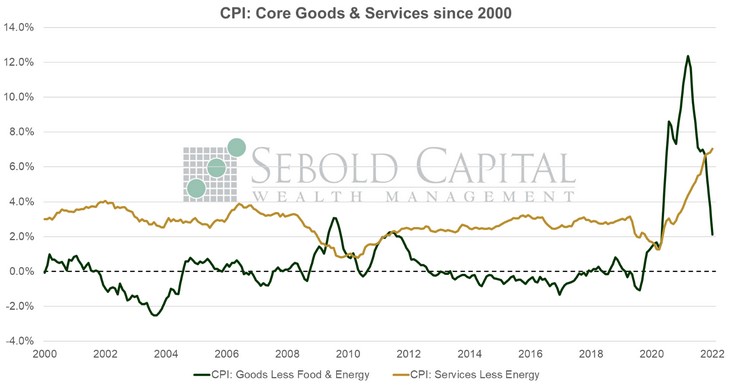
In a surprising turn of events, last month’s CPI report actually matched expectations after months of “inflation surprises”-most to the upside, some to the downside. Looking under the hood, the report showed that prices of goods continued to decelerate, while the cost of services rose to 7.5%, its highest level in over forty years. It looks like we are not quite done hitting four-decade highs. Housing costs also increased (0.8% on the month and 7.5% on an annual basis), however, this is hardly unexpected given the lag of Owners’ Equivalent Rent relative to actual home prices. The impact of shelter costs on the headline print was offset primarily by lower energy prices, which overall fell by 4.5% last month. Gasoline prices declined even further, falling by 9.4%. Transportation costs were also negative on a monthly basis, and the annual print softened considerably, declining from 7.8% to 3.7%. Food and beverage costs saw a slightly more moderate increase of 0.3%, although their year-over-year inflation print remained high at 10.1%.
The data continues to show that a less aggressive monetary policy would likely be appropriate. The only remaining drivers of inflation that are likely to continue showing up are the cost of services and the cost of housing. The former has likely been driven by wage pressures to a greater extent than goods inflation, but now those are starting to moderate as well. The latter will likely decline sometime in the near future as the data begins to catch up with reality. More importantly, M2 growth is now flat, if not slightly negative. The last print, which was for the month of November, showed a decline of 0.30 relative to October and a mere 0.01% increase on an annual basis. Inflation prints will likely continue to trend lower moving forward-with the corresponding monthly volatility.
January 12, 2023