 The Consumer Price Index (CPI) shows us inflationary pressures in the economy. The CPI measures the average price levels of a basket of goods and services purchased by consumers. The index starts with a base time period (1982-1984, currently) and shows the overall increase since that time. As with many economic indicators, it can be volatile from month to month, with food and energy prices often leading the volatility.
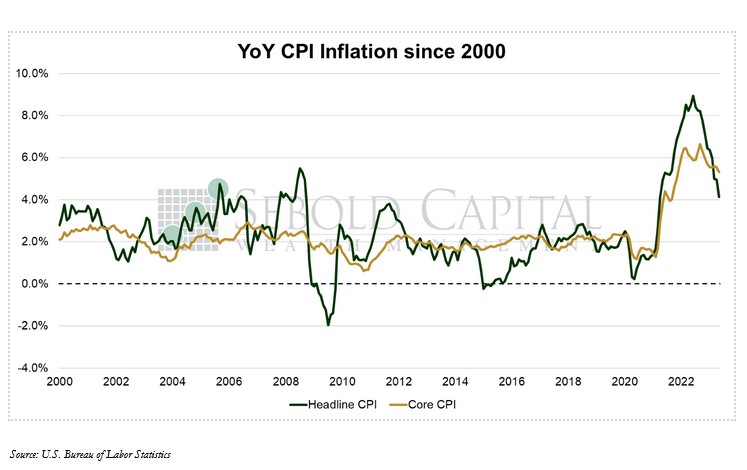
In May, the CPI increased to 304.1, coming in line with expectations. On a monthly basis, consumer prices rose by just 0.1%. The annual inflation rate declined from 4.9% to 4.0%, the lowest level in 2 years. Core inflation, which excludes food & energy and is therefore considered to be less volatile, declined from 5.5% to 5.3%, which was also in line with expectations. Core prices increased 0.4% from the previous month.
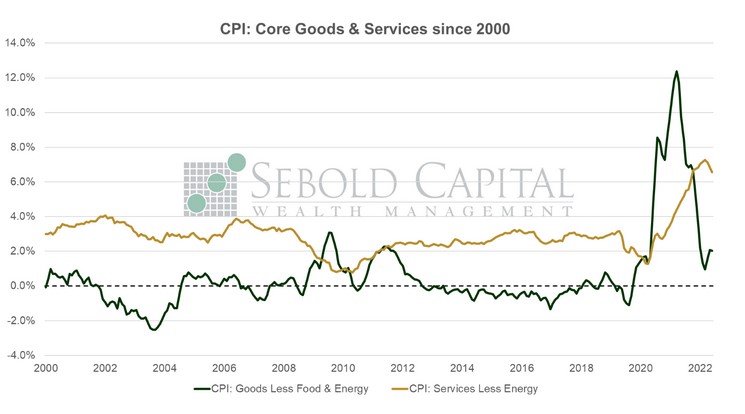
As expected, inflation continued to slow down last month, driven primarily by significant declines in energy and transportation prices. Energy prices declined 3.6% from the previous month and are down 11.3% on an annual basis. Transportation costs declined 0.2% from April. A 0.5% monthly increase in Owners’ Equivalent Rent-the index’s proxy for housing costs-offset some of those declines, contributing to the advance. On an annual basis, OER is up 8.1%, marking the third consecutive that this component of the index has been at this record high level. This helps explain why core inflation seems to remain stubbornly high; housing makes up an even more significant component of core prices given the exclusion of food and energy. As we have pointed out before, OER lags behind actual housing costs by several months, meaning that the true inflation rate is likely lower than the CPI might suggest. Fed officials should keep this in mind when assessing what monetary policy actions are appropriate. Inflation for services remained steady, posting its third consecutive 0.4% monthly increase; it currently sits at an annual rate of 6.6%, which is a moderate improvement from its high of 7.3% in February. The fact that wage growth has not picked up considerably should help moderate the cost of services in the upcoming months. Prices for goods in aggregate rose 0.5% last month and are up 2.0% since last year.
Overall, May’s CPI print is unlikely to alter the Fed’s inclination to stop hiking rates (at least temporarily) at their June meeting. The report shows the kind of progress on disinflation that they should expect to see. The CPI will likely continue to decelerate throughout the year as OER catches up to actual shelter costs. There is a large disconnect between OER and actual house prices. This will become more evident as the summer passes. While we would love to see a nice, smooth decline on the inflation front, we expect an increasingly bumpy ride.
June 13, 2023