 The Employment Situation is a report by the Bureau of Labor Statistics that gives us a look at the employment outlook of the US economy. The report does not include those employed in agriculture because of the seasonal nature of their work. This report obtains these numbers from 142,000 businesses and government agencies to track the new jobs added in non-farming sectors of the economy.
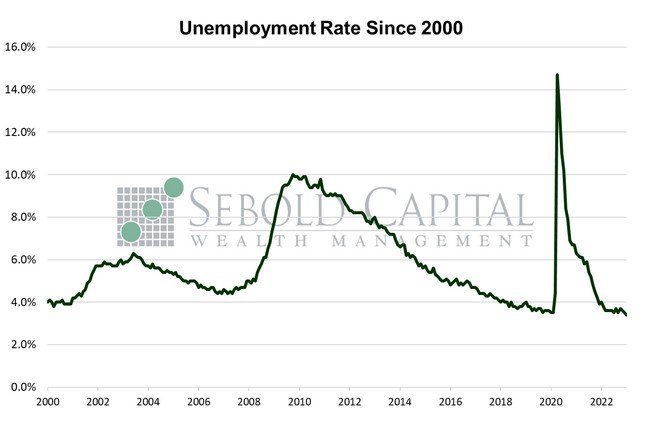
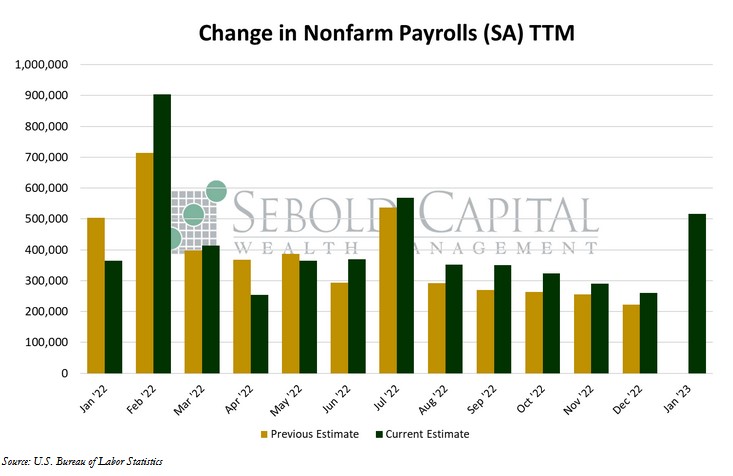
In January, U.S. employment rose by 517,000 on a seasonally adjusted basis, beating market expectations of a 190,000 advance by a very wide margin. This is in addition to multiple revisions which yielded a significant net gain in employment. The headline unemployment rate declined from 3.5% to 3.4%, against expectations of a 3.6% print. The average workweek increased from 34.4 to 34.7 hours. Average hourly earnings rose by 0.30% to $33.03, resulting in an annual increase of 4.4%. Average weekly earning saw a more significant 1.18% increase to $1,146.14. Last month’s decline, which had been the first one since January of 2022, was revised to the upside. The labor force participation rose last month from 62.3% to 62.4%, partly as a result of some of the revisions and changes to the survey’s methodology. Nevertheless, it remains below its pre-pandemic of 63.4%.
To the surprise of pretty much everyone, hiring seemingly accelerated in the first month of 2023. “Seemingly” is an important word here, because much of this acceleration was due to the numerous revisions that the Bureau of Labor Statistics made to its previous data and its methodology. Every payrolls report since last June was revised to the upside. The result was an additional 311,000 net payrolls added in 2022. Revisions were to be expected; the BLS always makes adjustments to the data in January. Perhaps one of the most significant revisions was updating the population estimates from January 2023 onwards, which will have an impact on how the labor force is measured. It will also make it more challenging to compare new estimates moving forward with pre-pandemic levels. The apparent increase in labor force participation can largely be attributed to this revision.
The report’s seasonal adjustments are once again playing a significant role in the reported employment gains. While the adjusted payrolls showed a significant increase of 517,000, the unadjusted number was -2.5 million. That is not abnormal by any means, as it is a well known fact that seasonal factors weight more heavily on January’s employment numbers than other months. However, prior seasonally adjusted January prints had been more muted, despite the unadjusted number showing a similar decline. It is likely that the BLS seasonal factors are overfitting to the significant decline in unadjusted employment of January 2022, causing the bigger than expected gain in payrolls. One important note is the bulk of job gains in January appear to have come from part-time employment as opposed to full time. The number of individuals working full time increased by 278,000, while the number of people working part time rose by 606,000. Now, these numbers come from the Population Survey—which is also used to calculate the unemployment rate—while the nonfarm payrolls print comes from the Establishment Survey, so they do not map out exactly to each other. However, the conclusion that can be derived from both of them remains the same—the jobs report was, in reality, less robust than it seemed on the surface.
February 3, 2023