 Gross Domestic Product (GDP) is the broadest measure of economic activity within a country and measures the market value of all final goods and services produced within a country over a certain period. There are four components GDP is created from: investment (including residential and nonresidential expenditures), consumption (including durable goods, nondurable goods, and services spending), government spending, and net exports (a country’s total exports minus its total imports).
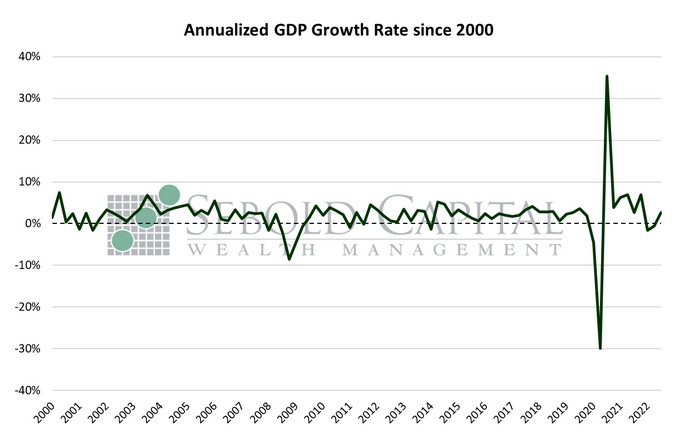
According to the Bureau of Economic Analysis’ first advance estimate for Q3, real GDP grew at an annual rate of 2.6%, up from -0.6% in the second quarter. The print came in slightly above expectations, which hovered at 2.4%. Consumption, government spending, and net exports all rose, while investment declined for the second consecutive quarter. The latest print also breaks the trend of negative GDP growth seen during the past two quarters.
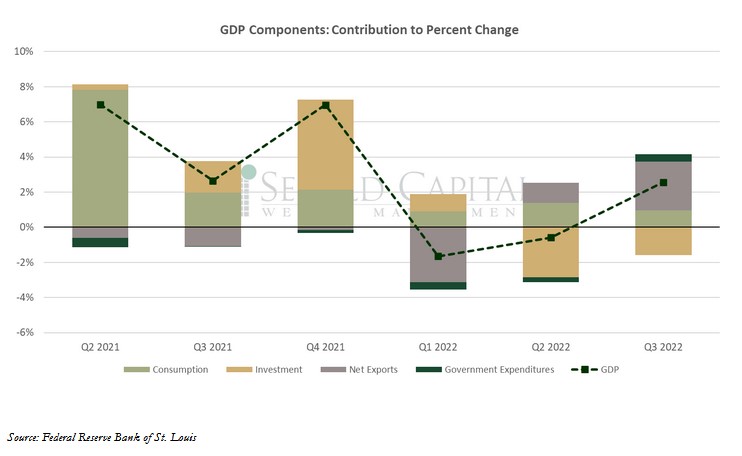
Personal consumption expenditures, which make up the largest share of GDP, increased at annual rate of 1.4%, a slowdown from last quarter’s 2.0% print. The estimate was about $14.1 trillion. Demand for goods declined, while spending on services drove the increase in consumption. However, even spending on services moderated relative to the second quarter. The overall contribution of consumer spending to GDP was 0.97%, down from 1.38% in Q2. Private domestic investment was weak, and it was actually the only category to have a negative contribution to the headline this quarter. Residential investment saw its most significant decline since Q2 2020, driven likely by rising borrowing costs and a cooling demand for housing. Nonresidential investment was positive, but it was not able to offset the decline in new housing construction. Inventories, which were one of the main contributors to last quarter’s decline in GDP fared slightly better in Q3, although they continued to have a negative contribution to the overall print. The main driver of GDP growth last quarter was net exports, which rose at an annual rate of nearly 13%. The trade deficit shrank for the second consecutive quarter and is now back below $1 trillion. However, it was mainly a slowdown in imports—as opposed to an increase in exports—that was responsible. The total value of goods and services imported fell 2.7%, while exports only rose 0.7%. While falling imports make a positive contribution to the calculation of GDP, they also suggest weakening consumer demand domestically. That is consistent with the decline in consumption relative to the previous quarter. Government spending increased in Q3 at an annual rate of 1.39%, and it had a positive contribution to the calculation. However, how much money the government spends can hardly be used as a metric to measure economic strength.
The GDP price index, used to adjust GDP for inflation, rose just 4.1%, well below the 5.3% that was expected. It is also a significant improvement from the previous quarter, when the deflator stood at 9.0%. The decline in core prices was less dramatic, falling from 4.7% to 4.5%, which was in line with expectations. The improvement in inflation—at least this particular measure of inflation—contributes to the notion that this GDP report was overall a positive one. Sure, the headline number overstates just how robust the economy is, but it still does not look recessionary. A decline in investment can be concerning, but it is not all that surprising considering how much borrowing costs have increased. That is certainly a headwind we will have to deal with for the foreseeable future. Now, this is only the first estimate and revisions are certainly possible. The most important thing, as always, is how the Fed will interpret the data. One can only hope that, when gauging the appropriate size of the next few rate hikes, they do not simply glance at headline number increasing from -0.6 to 2.6% and ignore growth in personal consumption declining from 2.0% to 1.4%. This tightening cycle has yet to cause an actual recession; that certainly does not mean that one is impossible. The market has already priced one in.
October 28, 2022