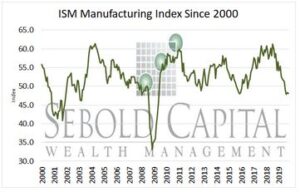
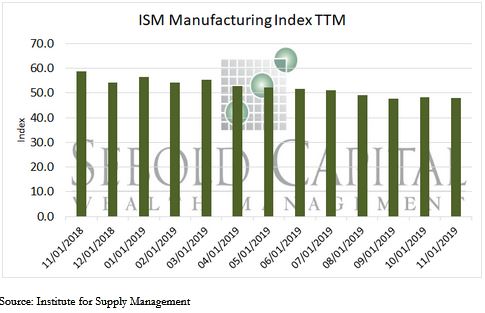
 The ISM Manufacturing Index is derived from a survey of purchasing managers and their outlook on overall conditions by looking at factors such as orders for durable goods, industrial production and hiring. It gives a general direction rather than the specific strength of the factory sector and manufacturing activity in the U.S. A reading above 50 is an indicator that the manufacturing sector is growing while a reading below 50 indicates a contraction.
The November ISM Manufacturing report came in at a level of 48.1, depicting a slight, 0.41% decrease since October. The index was lower than the expectation of 49.2. The index is down 18.2% from November of 2018, when it was at 58.8.
The continued contraction of manufacturing could be occurring due to the decrease in prices for the last six months; this month, we saw decreases in the price of aluminum, base oils, freight, polypropylene, and caustic soda. Furthermore, the service industry will likely continue to crowd out the manufacturing industry; this is evident from the 1.0% compounded annual growth rate of total jobs in the service industry from 2008 to 2018, as opposed to the YOY 0.5% decline of jobs in manufacturing last month. Contracting new orders and production in manufacturing are countered by low customers’ inventories because this suggests that consumers will need to buy products produced in factories moving forward, thus predicting eventual expansion in the manufacturing sector. Even if manufacturing contracts in the coming months, manufacturing only contributes to 11.6% of GDP, so such a decrease would not significantly hinder the growing U.S. economy.

12/3/2019
