 New single-family home sales represent the number of brand-new houses that were purchased or committed to being purchased over the course of a month. This data is collected from the Selling Office Commission and local building permit offices, under the assumption that new houses built are being built to sell. This indicator has a trickle-down effect, as demand rises for durable goods and consumer spending increases, boosting GDP. When people purchase a home, they buy goods to fill their homes with, lifting other sectors simultaneously. New home sales are also more impactful to GDP than existing home sales since the entire sale value is included instead of only the real estate commission being included for an existing home during the sale.
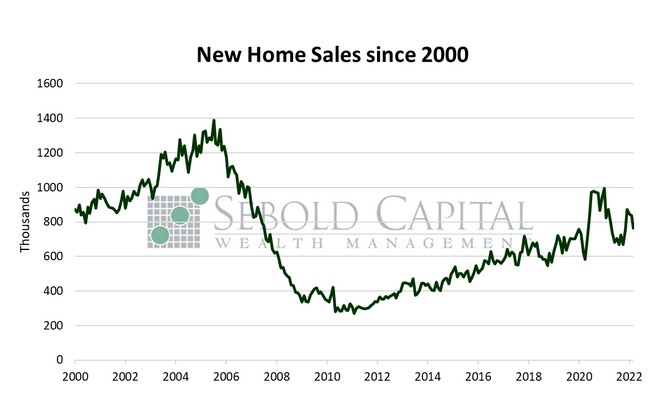
In March, new residential sales plunged by 8.6% to a total of 763,000 units, down from an upwardly revised 835,000 units in February. On a year-over-year basis, new home sales are down 12.6%. Sales declined across all four census regions. Home sales in the South fell by 10.2% to 414,000 and by 8.7% in the Midwest, falling to 94,000. Sales in the West region declined by 6.0% to 202,000, and sales in the Northeast fell by 5.4% to 53,000 units. The median sales price of a new home rose by 3.6% to $436,700, and it is up 21.4% since March 2021.
Last month, sales of newly-built single family homes declined, largely as a result of their affordability being greatly reduced by rising interest rates and asking prices. Higher borrowing costs in particular are likely to seriously dampen housing demand; when shopping for a home, people are usually far more concerned with their monthly payment than with the property’s asking price. Just to put things into perspective, the 30-year fixed mortgage rate on the last day of March was 4.7%, compared to 3.2% one year ago. Assuming a standard principal and interest monthly payment—even without accounting for any amount escrowed for property taxes or homeowner’s insurance—the difference in mortgage rates yields a payment that is 19.9% higher. No wonder that buyers seem unmotivated. Inventory also remains low, adding to existing pressures; builders continue to struggle with shortages and higher prices for inputs, leading to a substantial backlog of homes that have been approved for construction but have yet to be started. At last month’s sales pace, it would take 6.4 months to clear the supply of houses on the market, although that is an improvement over February’s 5.6 months. Rates will only continue to rise for the foreseeable future, and new homes cannot be conjured out of thin air even if there is demand for them. The housing market will undoubtedly see some interesting dynamics in the near term, although things will likely settle down once interest rates reach their terminal value and home prices return to a level that is consistent with higher borrowing costs. 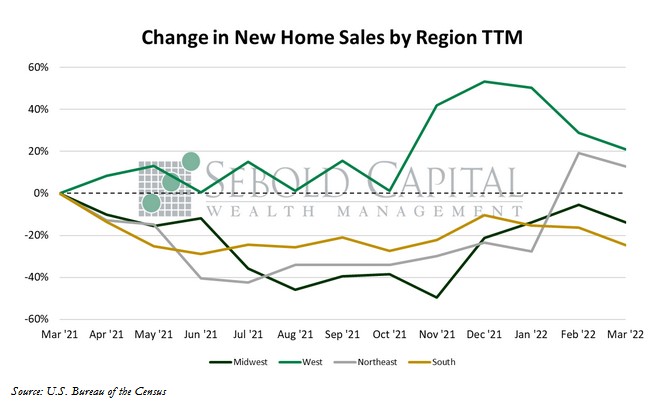
April 26, 2022