 Consumer spending, measured by Personal Consumption Expenditures (PCE), makes up approximately two-thirds of the economy and is a direct measure of purchasing activity. PCE is a reliable indication of inflation because it is calculated from data acquired directly from the GDP report and businesses. It shows us where consumers are spending their dollars, whether it be durable and non-durable goods, or on services. Changes in the personal income level usually dictate consumer spending.
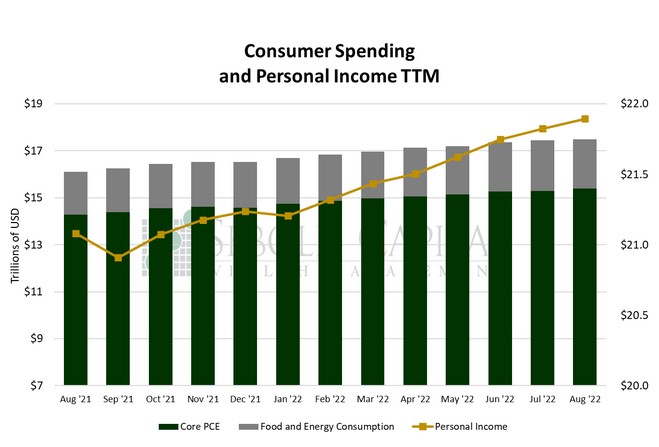
In August, personal consumption rose by 0.39% to a seasonally adjusted annual rate of $17.47 trillion, while personal income increased by 0.33% to $21.90 trillion. Excluding food and energy, consumption rose by 0.61% to $15.39 trillion. Spending on durable goods increased 0.11% to $2.20 trillion, while spending on non-durable goods declined by 0.84% to $3.76 trillion. Spending on services was 0.85% higher last month, coming in at $11.51 trillion.
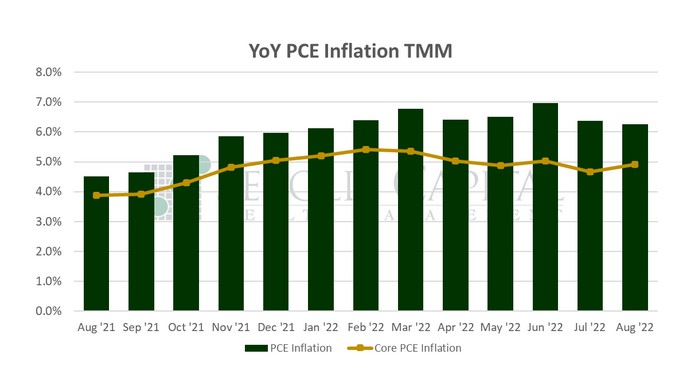
Consumer spending saw a boost last month as prices began rising again throughout the economy. The net increase would be somewhat lower, however, as July’s print was revised from 0.1% to -0.2%, offsetting some of August’s advance. Arguably the most awaited parts of the report were the price indices; headline prices had posted their first monthly decline since April 2020, creating hopes that inflation has finally peaked. Unfortunately, prices changed course last month and began increasing again. Although the headline year-over-year print declined from 6.4% to 6.2%, prices rose 0.3% from the previous month. Core prices fared worse, posting their second largest monthly increase this year (0.6%) and causing the annual print to rise from 4.7% to 4.9%. This is particularly significant because the latter serves as the Fed’s preferred inflation measure, so any significant movements will likely guide Fed policy for the next few meetings. It should also be noted that both prints came in above market expectations, and both were also upwardly revised for July.
One thing that recent inflation reports have highlighted is that prices are not moving in unison in one direction or another. Energy prices have eased after driving much of the inflation seen earlier this year; they fell 5.5% last month. However, prices are now rising more broadly. For instance, food prices increased 0.8% and the cost of services rose 0.6%. It is unclear whether the Fed’s more restrictive monetary policy will be able to moderate a more persistent core inflation, or how long that might take. Monetary policy is a blunt tool and impacts all industries indiscriminately. Using a hammer to perform heart surgery is going to leave some scars.
September 30, 2022