 Consumer spending, measured by Personal Consumption Expenditures (PCE), makes up approximately two-thirds of the economy and is a direct measure of purchasing activity. PCE is a reliable indication of inflation because it is calculated from data acquired directly from the GDP report and businesses. It shows us where consumers are spending their dollars, whether it be durable and non-durable goods, or on services. Changes in the personal income level usually dictate consumer spending.
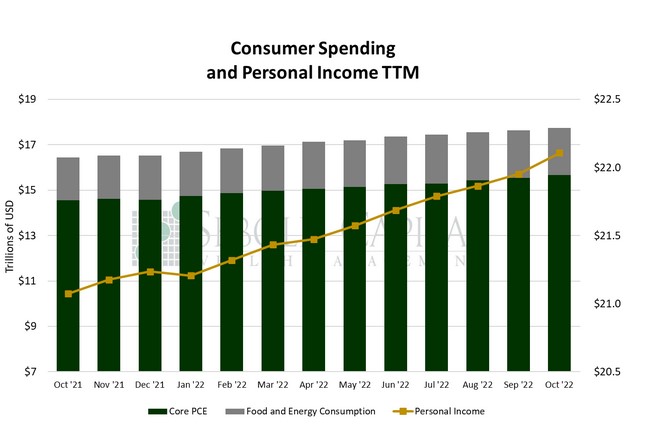
In October, personal consumption rose by 0.84% to a seasonally adjusted annual rate of $17.78 trillion, while personal income increased by 0.71% to $22.11 trillion. Excluding food and energy, consumption rose by 0.75% to $15.67 trillion. Spending on durable goods soared by 2.05% to $2.25 trillion, while spending on non-durable goods increased 1.07% to $3.84 trillion. Spending on services was 0.53% higher in October, coming in at $11.69 trillion.
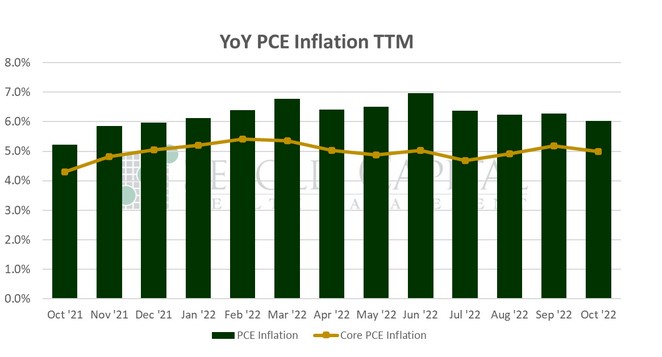
Consumer spending saw a boost last month, coming in slightly above expectations of a 0.6% advance. Interestingly, October’s increase was driven largely by new vehicle purchases. It appears that consumers were undeterred by rising borrowing costs. Spending on food and housing was also notably high. Inflation, as measured by the PCE price index, came in largely in line with expectations. On a monthly basis, prices increased 0.3%, matching the increases of the previous two months. The year-over-year print declined from 6.3% to 6.0%, although the expectation was 5.9%. Core prices rose by 0.2%, down from 0.5% the prior month. On an annual basis, core prices increased 5.0%, compared to the September print of 5.2%.
The personal income print was a much bigger surprise to the upside; the expectation was a 0.3% increase, and the actual print came in well above that. However, the savings rate fell to its lowest level since mid-2005—a mere 2.3%. Despite its name, the former does not measure how much consumers save per se, but rather the portion of after-tax income that consumers do not spend. Spending remains robust for now, and will likely continue throughout the holiday season, but consumers are spreading themselves increasingly thin to keep up. Consumption will likely moderate further next year, leading to slower economic growth, or at the very least to significantly less momentum.
December 1, 2022