 Consumer spending, measured by Personal Consumption Expenditures (PCE), makes up approximately two-thirds of the economy and is a direct measure of purchasing activity. PCE is a reliable indication of inflation because it is calculated from data acquired directly from the GDP report and businesses. It shows us where consumers are spending their dollars, whether it be durable and non-durable goods, or on services. Changes in the personal income level usually dictate consumer spending.
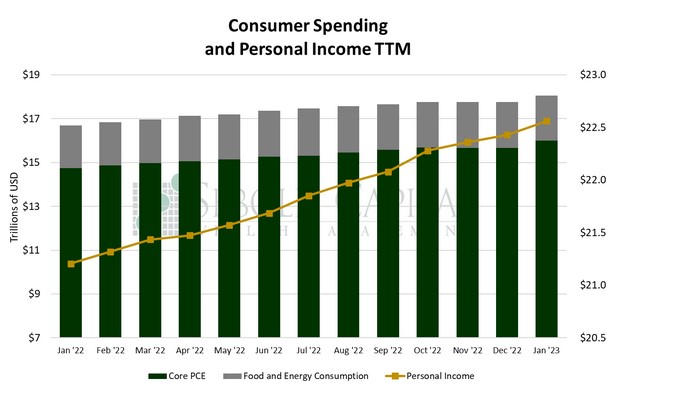
In January, personal consumption rose by 1.76% to a seasonally adjusted annual rate of $18.05 trillion, while personal income increased by a more modest 0.58% to $22.56 trillion. Excluding food and energy, consumption soared by 2.06% to $15.99 trillion. Consumer spending on services rose by 1.27% to 12.01 trillion. Spending on durable goods increased by 5.49% to $2.4 trillion, while purchases of non-durable goods rose by 1.22% to $3.8 trillion.
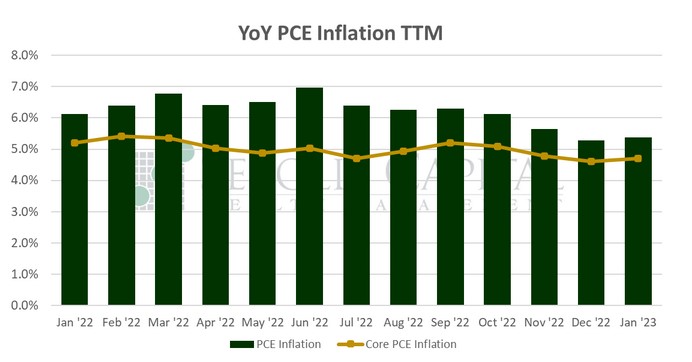
Consumer spending rose more than expected last month, reversing a small decline in December. Markets were expecting a 1.1% increase in the headline number. The largest contributor to last month’s increase in consumption was housing and utilities. Inflation, as measured by the PCE price index, also surprised to the upside. The expectation was for a month-over-month headline print of 0.3%; instead, we got double that at 0.6%. December’s increase was also revised to the upside, although only from 0.1% to 0.2%. The Core PCE price index saw nearly identical results, likewise increasing by 0.6% against the expected 0.3%. On an annual basis, inflation increased to 5.4% from 5.3% (which itself was revised from 5.0%), whereas the expectation was for 4.8%. Core inflation, which serves as the Fed’s preferred inflation indicator, increased from 4.6% to 4.7%, although the previous print was also revised to the upside.
In addition to several revisions, last month’s PCE report also had some changes to its methodology. In particular, previous estimates for personal income were updated with new wages and tax data from the BLS. It is likely that seasonal adjustments are also distorting January’s numbers-especially for consumption-like it has been theorized for other economic indicators which have been released in recent weeks. These higher than expected personal consumption numbers only further confirm the likelihood of further rate hikes this year. The current expectation is for a quarter point in March, followed by at least two more in May and June. There is very little to no consensus as to whether the Fed will keep hiking after that point, but at least the expectation that rates would be lower by the end of the year appears to have been mitigated.
February 24, 2023